Power BI — Demographics & Economy Île-de-France (2011–2022)
Context & scope
Total population, average unemployment rate %, aggregated GDP 2011–2022. Temporal + geographic perspective.
Report combining Power Query preparation and DAX model. Three sections: P1 Evolution, P2 Distribution, P3 Scenarios & Indicators.
← Back to Showcase- → P1 — Evolution
- → P2 — Distribution
- → P3 — Scenarios & Indicators
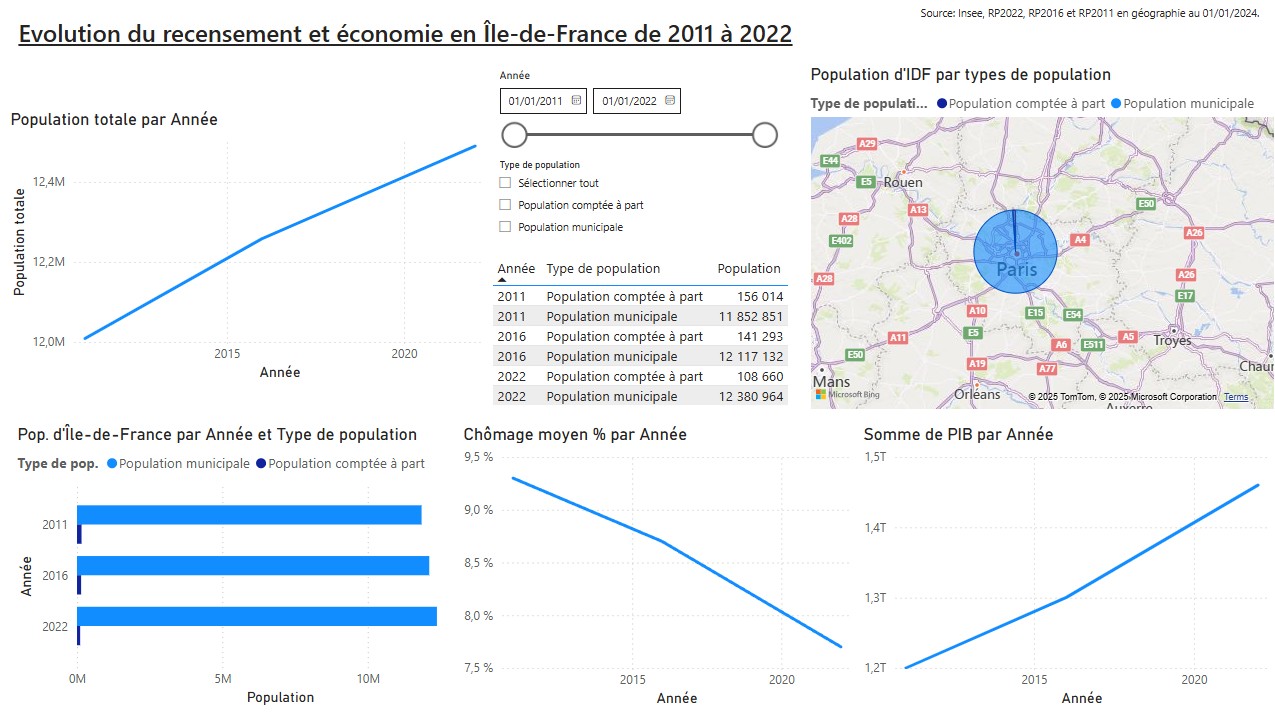
P1 — Census & Economic Evolution in Île-de-France (2011–2022)
Preparation (Power Query)
- Import RP2011/2016/2022, average unemployment rate %, annual GDP.
- Harmonization of vintages, label normalization, column typing.
- Controls: uniqueness year–value, handling missing data.
DAX Model (Indicators)
- Total population, Average unemployment rate %, Total GDP.
- Annual and average aggregations on selected period.
Visualizations & Interactions
- Population evolution curve.
- Proportional bubble map centered on Paris.
- Horizontal bars by population type.
- Evolution lines for unemployment % and GDP sum.
- Year and type segments.
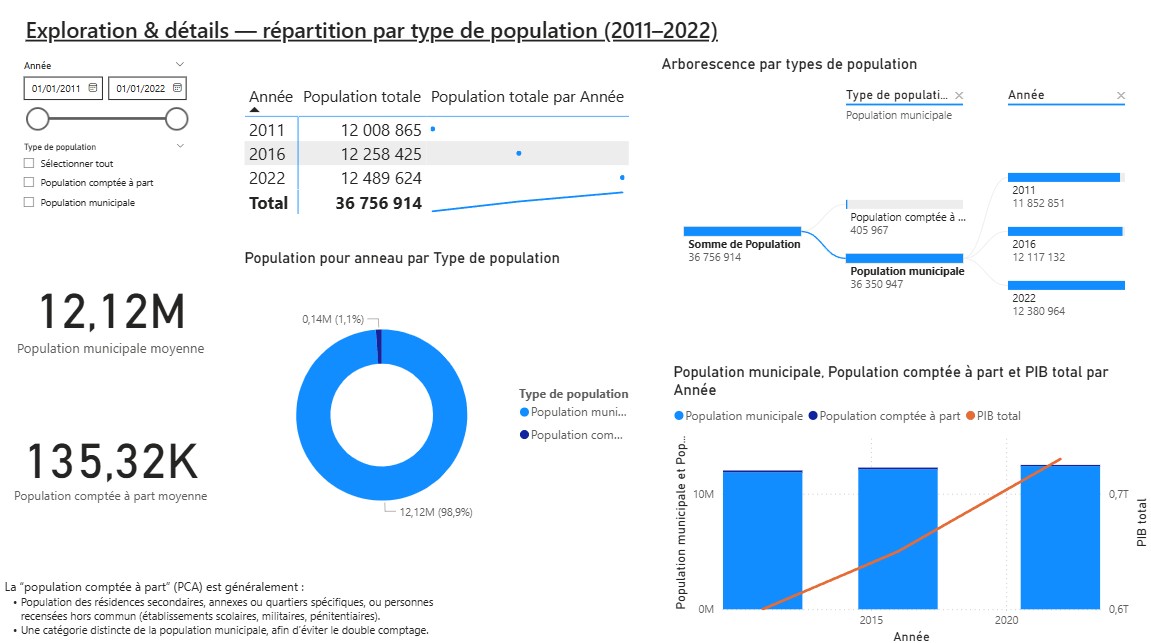
P2 — Exploration & Details: Population Distribution (2011–2022)
Preparation (Power Query)
- Harmonization of categories across vintages, label normalization.
- Derived columns for inter-annual comparisons.
- Quality checks: duplicates, missing values, total consistency.
DAX Model (Indicators)
- Averages and shares (%) by type over selected period.
- YoY variations (value & %), ratios vs total.
- Measures ready for decomposition tree.
Visualizations & Interactions
- Donut chart by type + bars by type/year.
- Population/GDP curve for trends.
- Year & Type segments, cross-selection and tooltips.
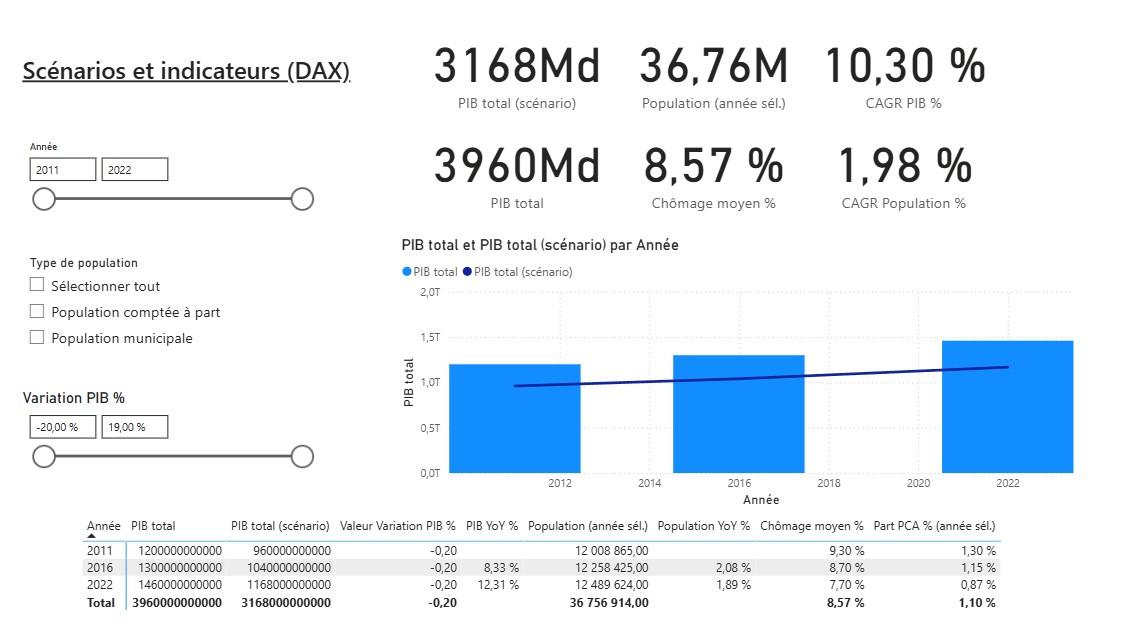
P3 — Scenarios & Indicators
Preparation (Parameters)
- GDP % Variation parameter table (what-if) exposed as segment.
- Year and Type segments for context.
- Consistent formats & units across KPIs.
DAX Model (Indicators)
- Total GDP (scenario) = GDP adjusted by parameter.
- KPIs: Total GDP, Population (selected year), GDP CAGR %, Population CAGR %, Average unemployment %.
- YoY dynamics (GDP/Population) and PCA % share.
Visualizations & Interactions
- KPI cards + combo column/line chart (GDP vs scenario).
- Synthesis table by year (values, YoY, shares).
- GDP % Variation segment: instant update of all visuals.